Analysis
Settings options under “Functions” > “Analysis.” Sensor readings can be analyzed and displayed.
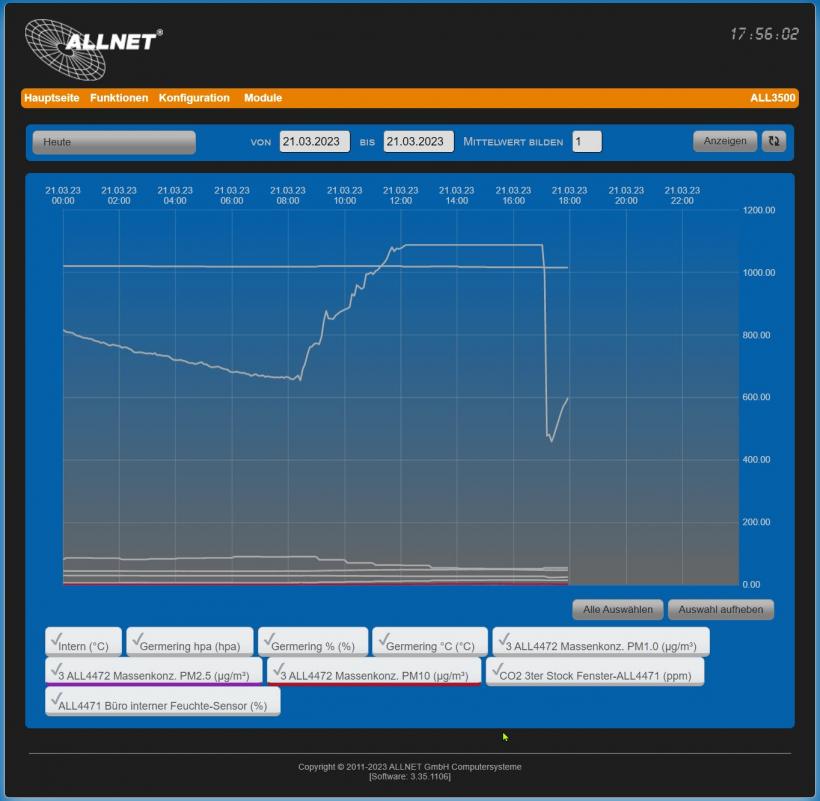
- Period from… to…
Use the drop-down menu to select either "Yesterday," "Today," "Week," or "Month," or enter a time period with a start date ("from") and an end date ("to").
- Recording Selection
If recording has been enabled under "Functions" > "Recording," a drop-down menu will appear in the upper-right corner to select the desired recording type.
- Ads
Clicking the "Display" button loads the data according to the default settings.
- Reset
Clicking the "Reset" button refreshes the loaded data and resets the zoom level.
- Show/Hide Curves
Using the buttons on the left below the graph, you can show or hide individual curves—provided that multiple curves are plotted.