Recording
Setting options under "Functions" > "Recording".
The values of sensors and actuators can be recorded long-term in a file in the device. This recording serves as the basis for the evaluation on this device (see section "7.7 Evaluation" on page 60). The file can also be downloaded as a CSV file and processed further on the PC using various programs. The device has approx. 4 GB of flash memory available for the data. A new file with a new name is created automatically every month (Year_Month.csv). Existing files are not deleted automatically.
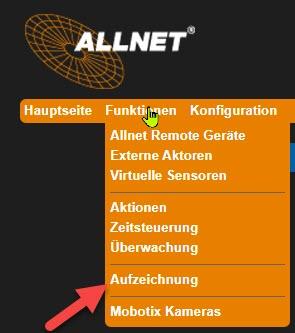
Please note the following difference: - "Interval recording": The value averaged over the set period (interval) is recorded.
- "Time recording": The instantaneous value is recorded at the set time interval.
"Interval recording" tab
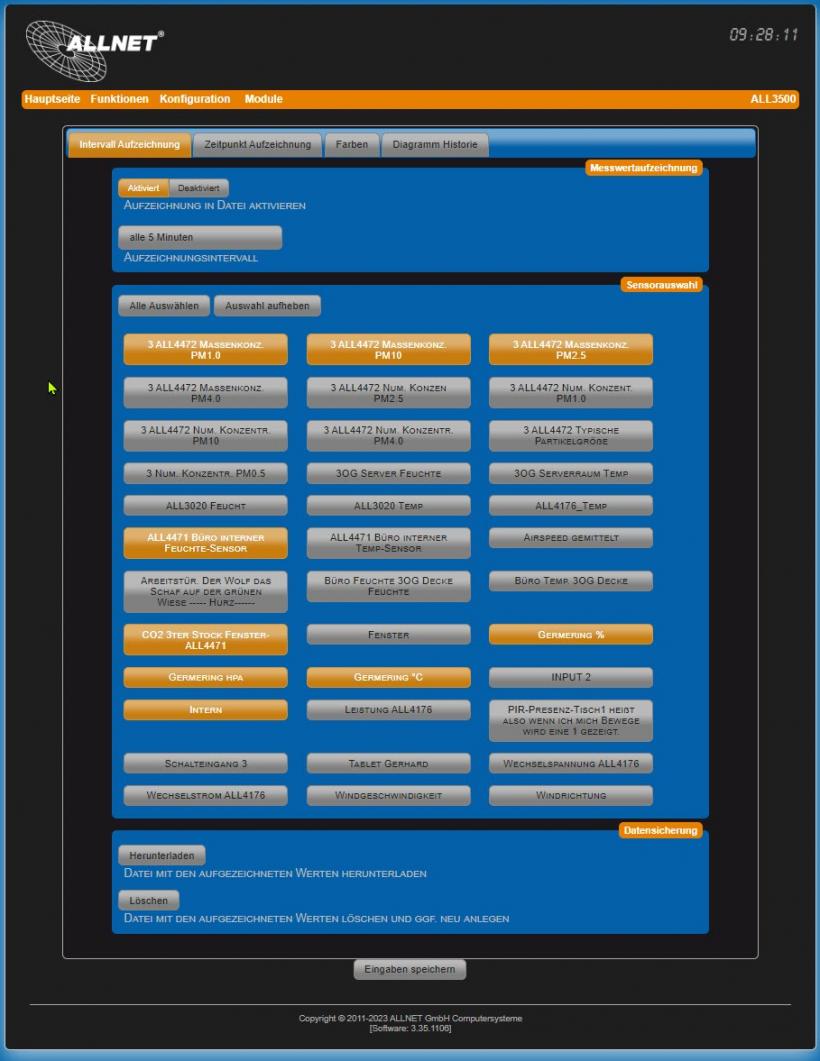
- Activate recording in file Default = Deactivated. Activate for recording.
- Recording interval Default = 5 minutes. The value is averaged over the set time interval and saved (see 7.6.2).
- Sensor selection Select the sensors whose data is to be saved in the file. All sensors are selected with the "Select all" button and deselected with "Deselect".
- Download Download the file with the displayed values. Enter the URL in the form: http://ipadresse/data/
- Delete Delete existing files. Please note that only all files can be deleted together!
"Time recording" tab
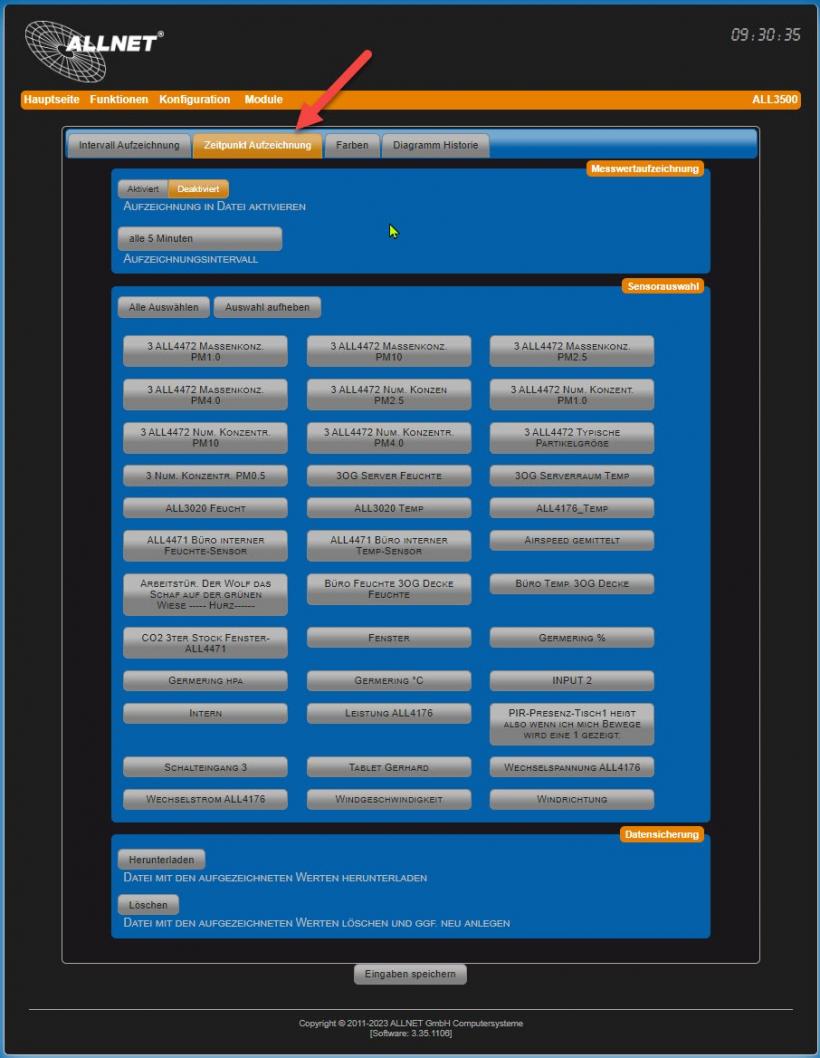
- Activate recording in file
Default = Deactivated. Activate for recording.
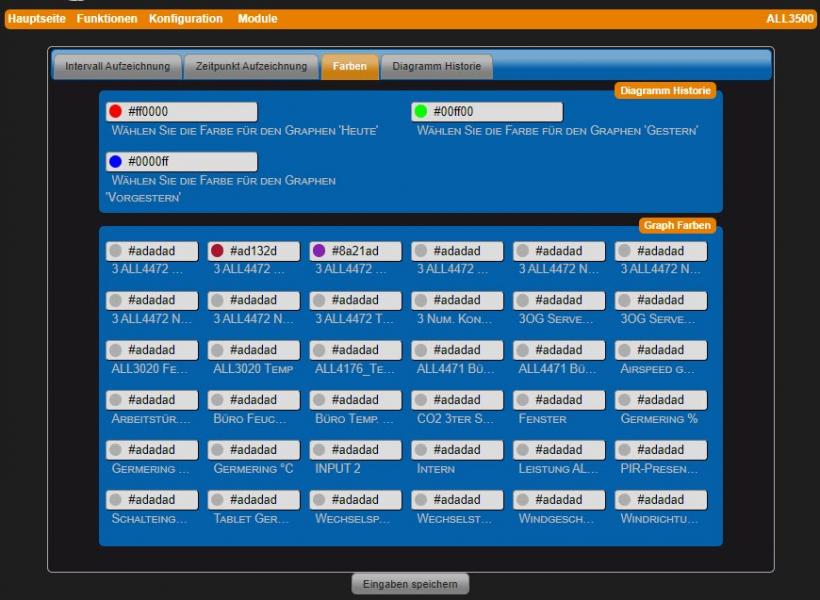
- Select the color for the 'Today' graph Color for the curve of the current day. Default: #ff0000 (red).
- Select the color for the graph 'Yesterday' Color for yesterday's curve. Default: #00ff00 (green).
- Select the color for the graph 'The day before yesterday' Color for the curve from the day before yesterday. Default: #0000ff (blue).
- Graph colors A color can be defined for each sensor value. Default for all sensors: #adadad (gray).
Default = 5 minutes. The value is averaged over the set time interval and saved
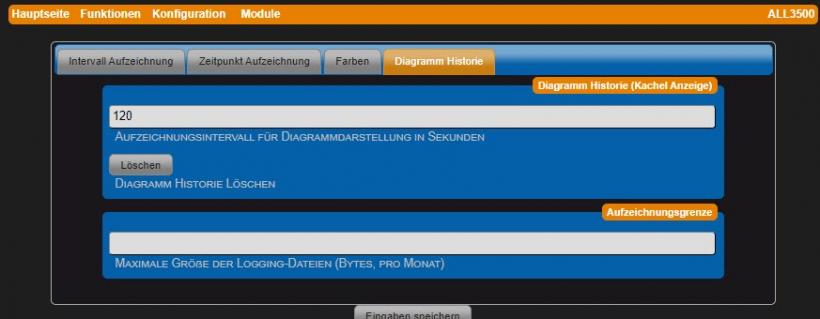
- Recording interval for diagram display... Recording interval for diagram display in seconds. Default: 240 seconds.
- Delete
Delete diagram history.
- Maximum size of logging files (bytes, per month)
Maximum size per log file in bytes. Debug outputs of the device daemons are saved monthly in a file (e.g. 201701.log, 201702.log,...). Default: 150,000 bytes.
- Delete
Delete existing files. Please note that only all files can be deleted together!
"Colors" tab
- Select the color for the 'Today' graph Color for the curve of the current day. Default: #ff0000 (red).
- Select the color for the 'Yesterday' graph Color for yesterday's curve. Default: #00ff00 (green).
- Select the color for the graphphen 'day before yesterday' Color for the curve from the day before yesterday. Default: #0000ff (blue).
"Diagram history" tab
- Recording interval for diagram display... Recording interval for diagram display in seconds. Default: 240 seconds.
- Delete
Delete diagram history.
- Maximum size of logging files (bytes, per month) Maximum size per log file in bytes. Debug outputs of the device daemons are saved monthly in a file (e.g. 201701.log, 201702.log,...). Default: 150,000 bytes.
"Access protection" tab
Restrict access to files in the /data directory.