Set Up the Web Interface
The available sensors and actuators can be placed and configured as desired on the web interface under "Home" > "Overview." The layout and color scheme are set under "Configuration" > "Device Settings."
Note: Please always use the latest browser versions.
Hidden Sensors
Hidden sensors and actuators can be unhidden in the "Home" > "Hidden Sensors" menu. This option is only visible if sensors or actuators have been hidden.

Move Sensor/Actuator
The sensor and actuator tiles can be distributed across multiple display pages. Each page can be given a name that matches the topic. (See: "Configuration" > "Device Settings").
Click this icon in the lower-left corner of the sensor/actuator tile. This will open a menu showing the pages that have already been configured.

Select the page you want.

Positioning a Sensor/Actuator
Note: To rearrange tiles within a display page, you must first click the icon in the lower-left corner of that page to enable moving.

You can move the sensor tile by clicking with the mouse within the label area.
Note: Move the mouse cursor over the assigned name. When the move icon appears, you can drag and drop it to the desired position.


Configure Actuator
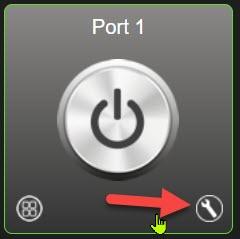
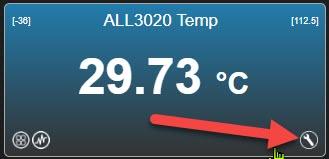
Click the tool icon to configure a sensor.
"Actuator" tab
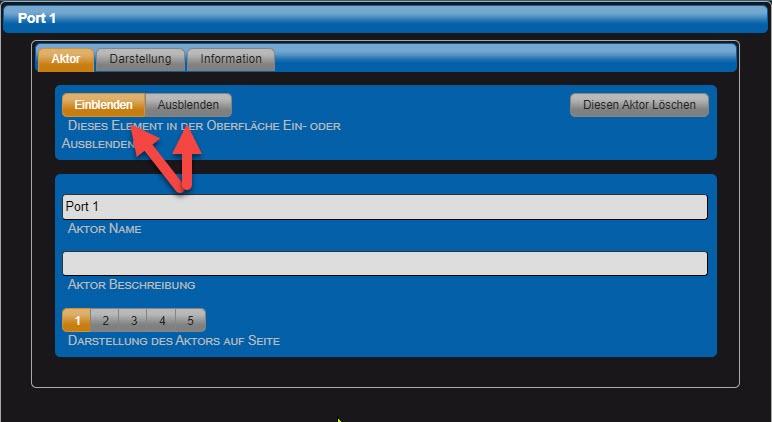
• Show or hide this element on the interface
Default = Show. If "Hide" is selected, the actuator will no longer appear on the web interface. However, logical evaluation of the signal is still possible. Hidden actuators can be displayed again via the “Main Page” > “Hidden Sensors” menu.
• Actuator Name This name will be displayed on the web interface. The text field is limited to 20 characters.
• Actuator Description This text is for informational purposes only.
• Depiction of the actor on the page Selecting the display page for the actuator.
• Delete this actuator (for remote actuators only) Use this button to delete the remote actuator.
"Display" tab
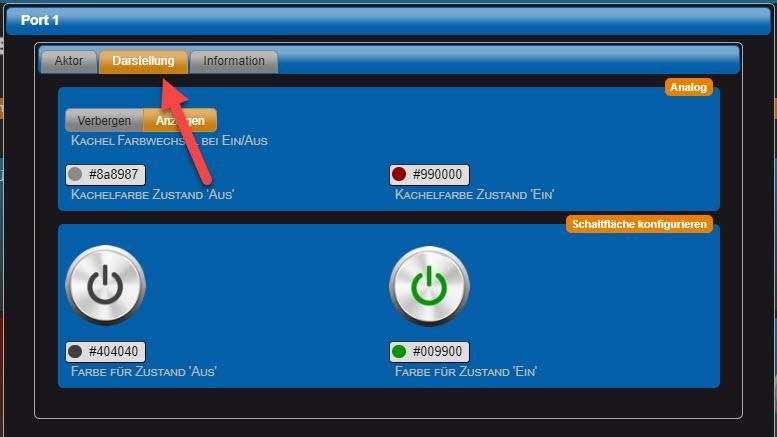
Tile Color Change When Turned On/Off The tile's background color changes based on the following two parameters.
• Tile Color Status: 'Off' Use the color picker to set the desired tile color.
• Tile Color Status 'On' Use the color picker to set the desired tile color.
• Color for the 'Off' state Use the color picker to set the desired color for the button.
• Color for the "On" state Use the color picker to set the desired color for the button.
"Information" tab
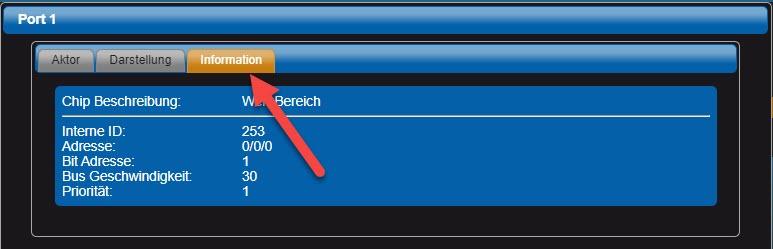
Note: This tab is only active in Expert View. Display system information via the actuator.
Configure Sensor
"Sensor" tab
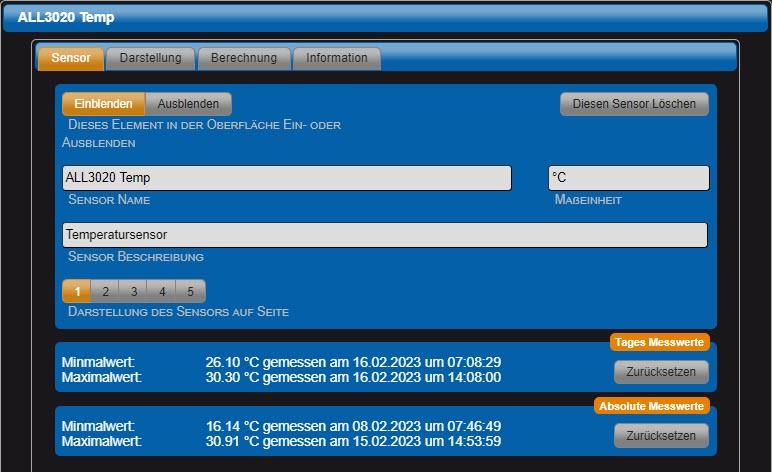
• Show or hide this element on the interface Default = Show. If "Hide" is selected, the sensor will no longer appear on the web interface. However, logical evaluation of the signal is still possible. Hidden sensors can be displayed again via the "Home" > "Hidden Sensors" menu.
• Sensor Displays Default = Enabled. If "Disabled" is selected, the sensor will no longer appear on the display page. Logical evaluation of the signal is still possible.
• Sensor Name This name will be displayed on the web interface. The text field is limited to 20 characters.
• Unit of measurement The physical unit to be displayed for this sensor.
• Sensor Description This text is for informational purposes only.
• Illustration of the sensor on the page Select the display page for the sensor.
• Daily readings Today's minimum and maximum values.
• Absolute measurements Minimum and maximum values over the device's entire recording period.
• Delete this sensor (for remote sensors only) Use this button to delete the remote sensor.
"Display" tab
Sensor Display: There are three types of display:

"Instrument" Display Format

Display the sensor value as text.

• Select the sensor display
Here: Text.
• Minimum and maximum values
The display shows the minimum and maximum marks.
• Font size
Font size for text display. Default: 55.
• Lower threshold for sensor
Lower threshold value for the sensor.
• Upper threshold sensor
Upper threshold value for the sensor.
• Tile color: 'Normal'
Use the color picker to select the desired color.
• Tile Color: 'Min' Status
Use the color picker to select the desired color.
• Tile Color: 'Min' Status
• Select the sensor display
Here: Instrument.
"Instrument" display format
Display the sensor value using an analog instrument.


Note: If you hover your mouse over Types 1 through 7, you can see what they look like.
• Select the sensor display
Here: Instrument.
• Change color when the value is above or below the threshold
The background color of the gauge changes when the value exceeds or falls below a threshold.
• Lower threshold for sensor
Lower threshold value for the sensor.
• Upper threshold sensor
Upper threshold value for the sensor.
• Tile color: 'Normal'
Use the color picker to select the desired color.
• Tile Color: 'Min' Status
"Chart" display format

Display the sensor value as a graph.

• Select the sensor display
Here: Diagram.
• Tile height
Choose between single and double tile heights.
• Change color when the value is above or below the threshold
The background color of the gauge changes when the value exceeds or falls below a threshold.
• Lower threshold for sensor
Lower threshold value for the sensor.
• Upper threshold sensor
Upper threshold value for the sensor.
• Tile color: 'Normal'
Use the color picker to select the desired color.
• Tile Color: 'Min' Status
Use the color picker to select the desired color.
• Tile Color: 'Max'
Use the color picker to select the desired color.
• Sensor Display: Minimum Value
Minimum value of the graph.
• Sensor Display: Maximum Value
Minimum value of the graph.
• Select the color for the graph
Use the color picker to select the desired color.
• Fill to the axis
The representation is rendered as a surface.
• Lower threshold
Default: Show. Color can be selected.
• Upper threshold
Default: Display. Color can be selected.
Use the color picker to select the desired color.
• Tile Color: 'Max'
Use the color picker to select the desired color
• Select the instrument type to display
There are currently 7 types to choose from. (More may follow.)
• Sensor Display: Minimum Value
Minimum value displayed on the instrument.
• Sensor Display: Maximum Value
Minimum value displayed on the instrument.
• LCD for displaying values
In addition to the pointer display, the value is shown in the format of an LCD display.
• Section Markers
Show section markers. Default: Hide.
• Tile Color: 'Max'
Use the color picker to select the desired color
"Calculation" tab

Note: This tab is only active in Expert View.
By enabling the calculation function, the sensor value can be scaled or offset. The expression can consist of up to two additions and two multiplications. The calculations only work with sensors that have been added via the I2C port. This means that power meter readings or readings imported from other devices cannot be included in the calculations. Alternatively, however, you can create a clone of readings that cannot be directly included in the calculation (see the “Duplicate Sensor” function in the “Functions” menu > “Virtual Sensors” > “+” button). You can then use this virtual sensor in your calculations.
• Enable / Disable Calculation Function Default = Disabled. Only readings from sensors connected via the I2C port and virtual sensors can be used. New value = (((Sensor value + Addition 1) Multiplication 1) + Addition 2) Multiplication 2
• Addition 1 Term for the first addition. Default = 0.
• Multiplication 1 Multiplier for the first multiplication. Default = 1.
• Addition 2 Term for the second addition. Default = 0
• Multiplication 2 Multiplier for the second multiplication. Default = 1.
• Calculate the average of the measured values [Off] Number of data points to be averaged. Default = 0 (no averaging).
"Information" tab

Note: This tab is only active in Expert View.
Display system information about the sensor, such as the chip ID used by the sensor and whether it is a native sensor or a remote sensor.
History of Sensor Data
Click the graph icon on the sensor tile in the lower-left corner to open the graph view. For each sensor, the measurement values from the last 72 hours can be displayed separately by day (today, yesterday, the day before yesterday), making it easy to compare them.

• Today / Yesterday / The day before yesterday Click the corresponding button to show or hide the graphs for each day.
• Auto-scaling When you click the "Auto-Scale" button, the scale is based on the actual minimum and maximum values measured. Clicking it again restores normal scaling, meaning the scale is based on the upper and lower display limits.
• Double-click on the graphic Double-clicking the graph shortens the time period displayed in the chart with each double-click. You can move the display area by holding down the left mouse button and dragging the mouse pointer.
• Hover the mouse pointer over the curve When you move the mouse pointer over individual curve points, the corresponding value appears in detail in a text box.
